
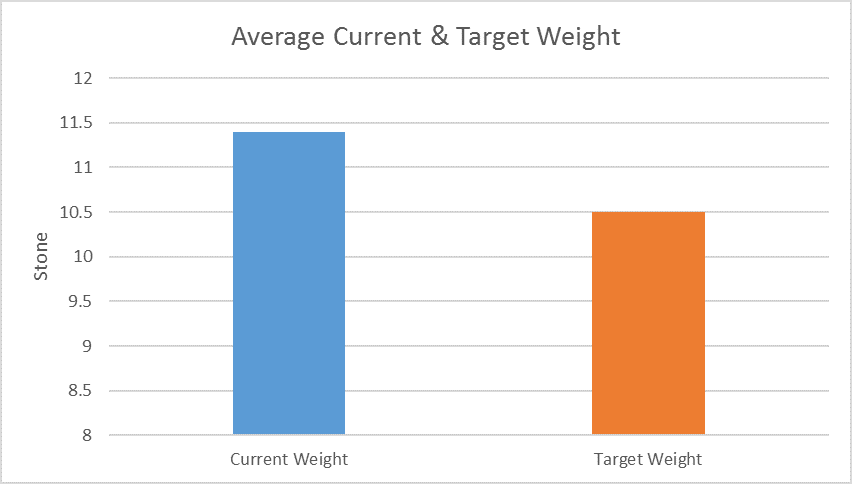
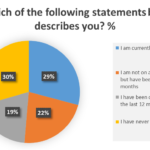
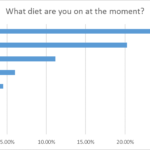
Low Sugar Diet » graph 2
 |
| 
This entry was posted on Tuesday, July 26th, 2016 at 12:15 pm and is filed under . You can follow any responses to this entry through the RSS 2.0 feed. You can skip to the end and leave a response. Pinging is currently not allowed.